Paper 1, Section II, J
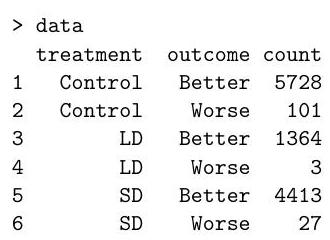
The following data were obtained in a randomised controlled trial for a drug. Due to a manufacturing error, a subset of trial participants received a low dose (LD) instead of a standard dose (SD) of the drug.

(a) Below we analyse the data using Poisson regression:

(i) After introducing necessary notation, write down the Poisson models being fitted above.
(ii) Write down the corresponding multinomial models, then state the key theoretical result (the "Poisson trick") that allows you to fit the multinomial models using Poisson regression. [You do not need to prove this theoretical result.]
(iii) Explain why the number of degrees of freedom in the likelihood ratio test is 2 in the analysis of deviance table. What can you conclude about the drug?
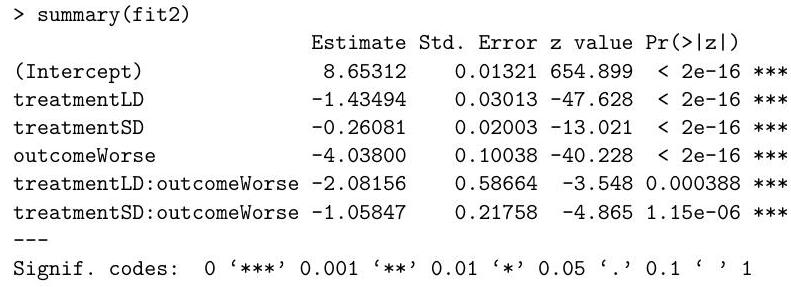
(b) Below is the summary table of the second model:

(i) Drug efficacy is defined as one minus the ratio of the probability of worsening in the treated group to the probability of worsening in the control group. By using a more sophisticated method, a published analysis estimated that the drug efficacy is for the LD treatment and for the treatment. Are these numbers similar to what is obtained by Poisson regression? [Hint: , and , where is the base of the natural logarithm.]
(ii) Explain why the information in the summary table is not enough to test the hypothesis that the LD drug and the SD drug have the same efficacy. Then describe how you can test this hypothesis using analysis of deviance in .