Paper 3, Section I, K
The command
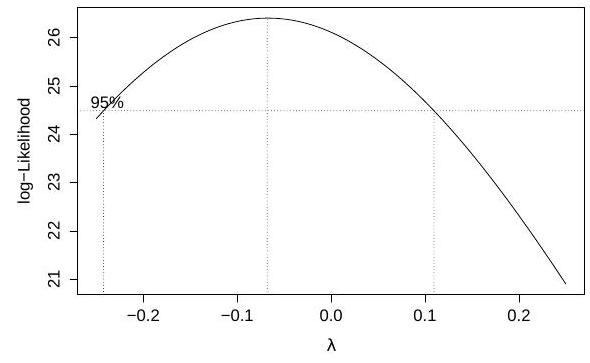
rainfall month+elnino+month:elnino)
performs a Box-Cox transform of the response at several values of the parameter , and produces the following plot:
We fit two linear models and obtain the Q-Q plots for each fit, which are shown below in no particular order: 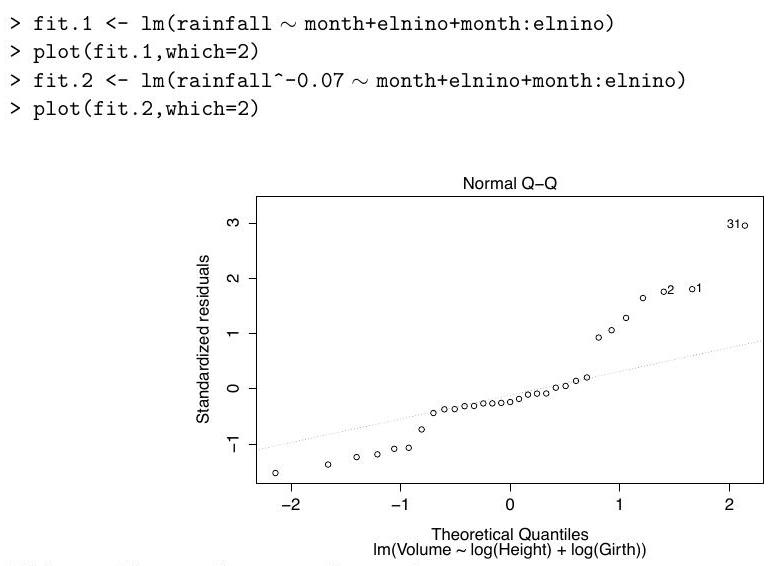
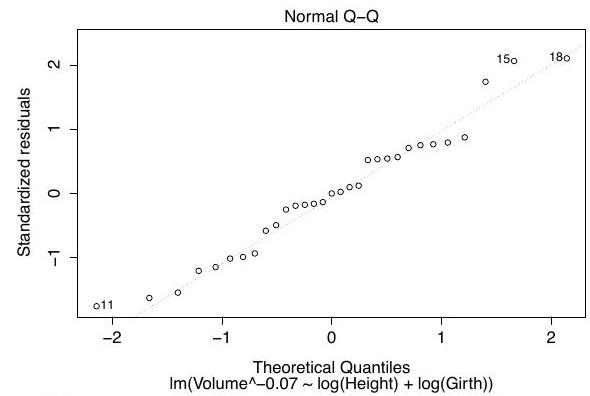
Define the variable on the -axis in the output of boxcox, and match each Q-Q plot to one of the models.
After choosing the model fit.2, the researcher calculates Cook's distance for the th sample, which has high leverage, and compares it to the upper -point of an distribution, because the design matrix is of size . Provide an interpretation of this comparison in terms of confidence sets for . Is this confidence statement exact?
Typos? Please submit corrections to this page on GitHub.