Paper 4, Section I, J
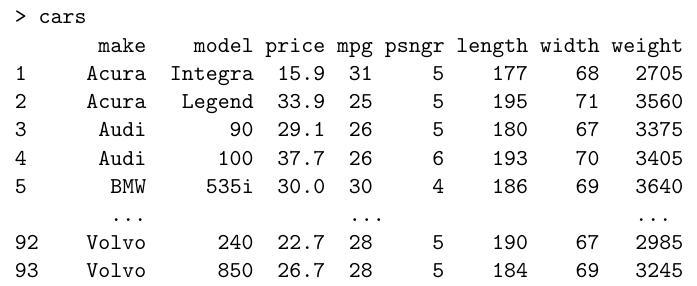
Below is a simplified 1993 dataset of US cars. The columns list index, make, model, price (in , miles per gallon, number of passengers, length and width in inches, and weight (in pounds). The data are displayed in as follows (abbreviated):
It is reasonable to assume that prices for different makes of car are independent. We model the logarithm of the price as a linear combination of the other quantitative properties of the cars and an error term. Write down this model mathematically. How would you instruct to fit this model and assign it to a variable "fit"?
provides the following (slightly abbreviated) summary:

Briefly explain the information that is being provided in each column of the table. What are your conclusions and how would you try to improve the model?