Paper 1, Section II, I
A three-year study was conducted on the survival status of patients suffering from cancer. The age of the patients at the start of the study was recorded, as well as whether or not the initial tumour was malignant. The data are tabulated in as follows:
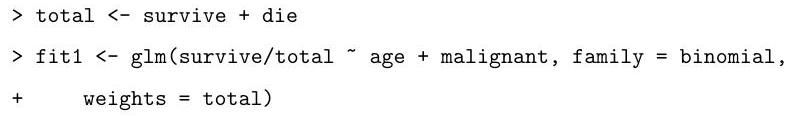
Describe the model that is being fitted by the following commands:
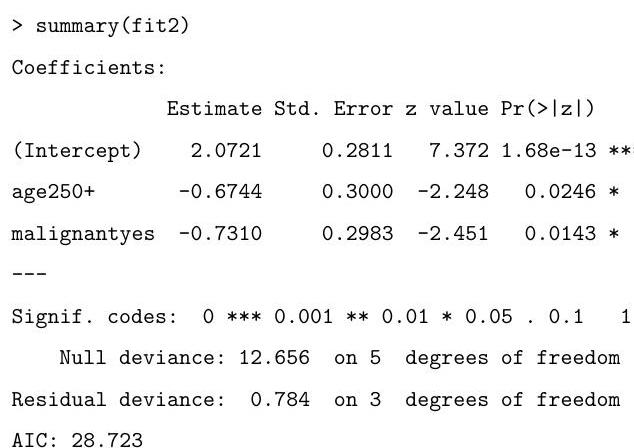
Explain the (slightly abbreviated) output from the code below, describing how the hypothesis tests are performed and your conclusions based on their results.

Based on the summary above, motivate and describe the following alternative model:

Based on the output of the code that follows, which of the two models do you prefer? Why?
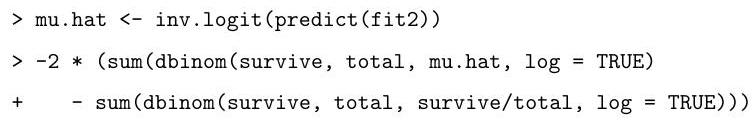
What is the final value obtained by the following commands?
Typos? Please submit corrections to this page on GitHub.