The table below gives a year-by-year summary of the career batting record of the baseball player Babe Ruth. The first column gives his age at the start of each season and the second gives the number of 'At Bats' (AB) he had during the season. For each At Bat, it is recorded whether or not he scored a 'Hit'. The third column gives the total number of Hits he scored in the season, and the final column gives his 'Average' for the season, defined as the number of Hits divided by the number of At Bats.
Age 19202122232425262728293031323334353639303593233 AB 109213612331743245754040652252935949554053649951853436572138105123 Hits 229374095139172204128205200134184192173172186199156130.3010.288 Average 0.2000.3150.2720.3250.3000.3220.3760.3780.3150.3930.3780.3730.3720.3560.3230.3450.3590.3730.3410.181
Explain and interpret the R commands below. In particular, you should explain the model that is being fitted, the approximation leading to the given standard errors and the test that is being performed in the last line of output.

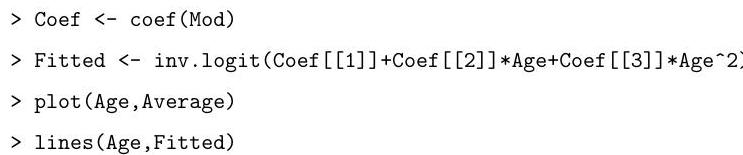
Assuming that any required packages are loaded, draw a careful sketch of the graph that you would expect to see on entering the following lines of code: