A2.12
(i) Suppose we have independent observations , and we assume that for is Poisson with mean , and , where are given covariate vectors each of dimension , where is an unknown vector of dimension , and . Assuming that span , find the equation for , the maximum likelihood estimator of , and write down the large-sample distribution of .
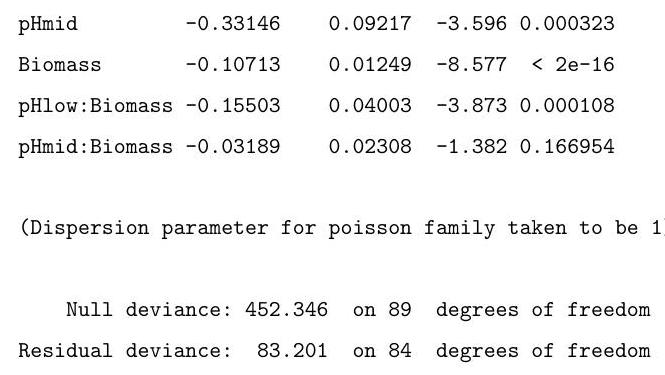
(ii) A long-term agricultural experiment had 90 grassland plots, each , differing in biomass, soil pH, and species richness (the count of species in the whole plot). While it was well-known that species richness declines with increasing biomass, it was not known how this relationship depends on soil pH, which for the given study has possible values "low", "medium" or "high", each taken 30 times. Explain the commands input, and interpret the resulting output in the (slightly edited) output below, in which "species" represents the species count.
(The first and last 2 lines of the data are reproduced here as an aid. You may assume that the factor pH has been correctly set up.)