Paper 1, Section II, J
We consider a subset of the data on car insurance claims from Hallin and Ingenbleek (1983). For each customer, the dataset includes total payments made per policy-year, the amount of kilometres driven, the bonus from not having made previous claims, and the brand of the car. The amount of kilometres driven is a factor taking values , or 5 , where a car in level has driven a larger number of kilometres than a car in level for any . A statistician from an insurance company fits the following model on .
model1 <- Im(Paymentperpolicyyr as numeric(Kilometres) Brand Bonus)
(i) Why do you think the statistician transformed variable Kilometres from a factor to a numerical variable?
(ii) To check the quality of the model, the statistician applies a function to model1 which returns the following figure:
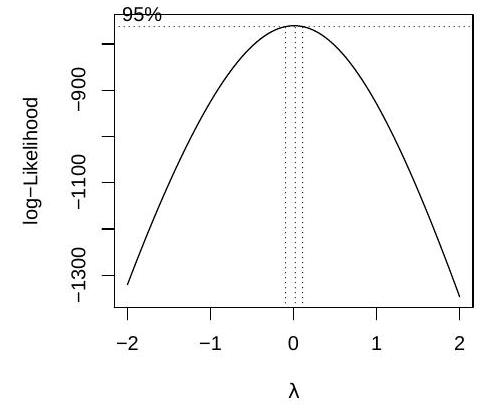
What does the plot represent? Does it suggest that model1 is a good model? Explain. If not, write down a model which the plot suggests could be better.
(iii) The statistician fits the model suggested by the graph and calls it model2. Consider the following abbreviated output:
Coefficients:
Brand2
Brand9
Bonus

Signif. codes: 0 '' '' '' '.' ' 1
Residual standard error: on 284 degrees of freedom ..
Using the output, write down a prediction interval for the ratio between the total payments per policy year for two cars of the same brand and with the same value of Bonus, one of which has a Kilometres value one higher than the other. You may express your answer as a function of quantiles of a common distribution, which you should specify.
(iv) Write down a generalised linear model for Paymentperpolicyyr which may be a better model than model1 and give two reasons. You must specify the link function.