Paper 4, Section I, J
Suppose you have a data frame with variables response, covar1, and covar2. You run the following commands on .

...
(a) Consider the following three scenarios:
(i) All the output you have is the abbreviated output of summary (model) above.
(ii) You have the abbreviated output of summary (model) above together with
Residual standard error: on 47 degrees of freedom
Multiple R-squared: , Adjusted R-squared:
F-statistic: on 2 and 47 DF, p-value: <
(iii) You have the abbreviated output of summary (model) above together with
Residual standard error: on 47 degrees of freedom
Multiple R-squared: , Adjusted R-squared:
F-statistic: on 2 and 47 DF, p-value:
What conclusion can you draw about which variables explain the response in each of the three scenarios? Explain.
(b) Assume now that you have the abbreviated output of summary (model) above together with
anova(lm(response response , model
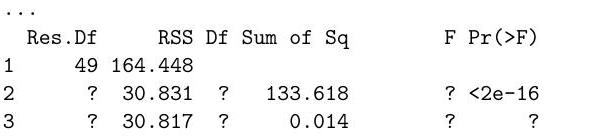
What are the values of the entries with a question mark? [You may express your answers as arithmetic expressions if necessary].