Paper 1, Section I, J
The dataset ChickWeights records the weight of a group of chickens fed four different diets at a range of time points. We perform the following regressions in .
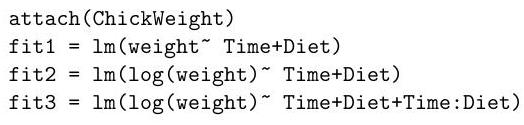
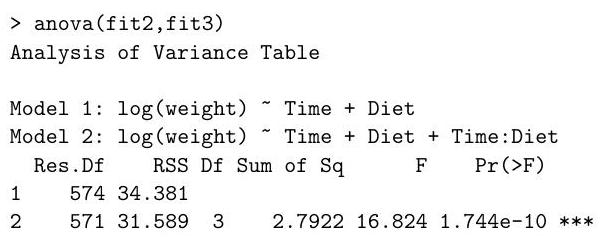
(i) Which hypothesis test does the following command perform? State the degrees of freedom, and the conclusion of the test.
(ii) Define a diagnostic plot that might suggest the logarithmic transformation of the response in fit2.
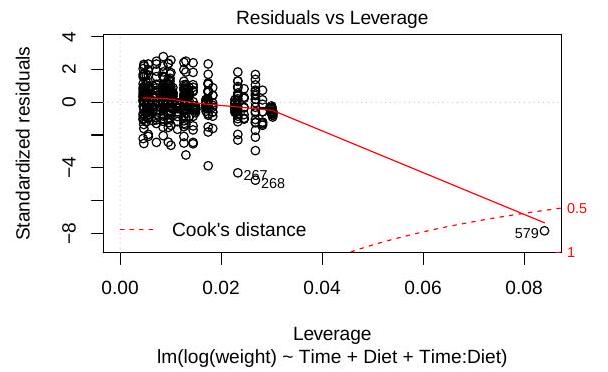
(iii) Define the dashed line in the following plot, generated with the command plot(fit3). What does it tell us about the data point 579 ?
Typos? Please submit corrections to this page on GitHub.