Paper 1, Section II, J
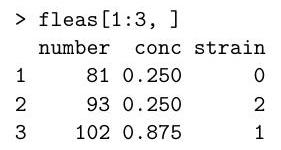
An experiment is conducted where scientists count the numbers of each of three different strains of fleas that are reproducing in a controlled environment. Varying concentrations of a particular toxin that impairs reproduction are administered to the fleas. The results of the experiment are stored in a data frame in , whose first few rows are given below.

The full dataset has 80 rows. The first column provides the number of fleas, the second provides the concentration of the toxin and the third specifies the strain of the flea as factors 0,1 or 2 . Strain 0 is the common flea and strains 1 and 2 have been genetically modified in a way thought to increase their ability to reproduce in the presence of the toxin.
Explain and interpret the commands and (abbreviated) output below. In particular, you should describe the model being fitted, briefly explain how the standard errors are calculated, and comment on the hypothesis tests being described in the summary.

Explain and motivate the following code in the light of the output above. Briefly explain the differences between the models fitted below, and the model corresponding to it

Denote by the three models being fitted in sequence above. Explain the hypothesis tests comparing the models to each other that can be performed using the output from the following code.
fit1$dev, fit2$dev, fit3$dev)
[1]
[1]
Use these numbers to comment on the most appropriate model for the data.