Paper 1, Section II, K
The treatment for a patient diagnosed with cancer of the prostate depends on whether the cancer has spread to the surrounding lymph nodes. It is common to operate on the patient to obtain samples from the nodes which can then be analysed under a microscope. However it would be preferable if an accurate assessment of nodal involvement could be made without surgery. For a sample of 53 prostate cancer patients, a number of possible predictor variables were measured before surgery. The patients then had surgery to determine nodal involvement. We want to see if nodal involvement can be accurately predicted from the available variables and determine which ones are most important. The variables take the values 0 or 1 .
An indicator no yes of nodal involvement.
aged The patient's age, split into less than and 60 or over .
stage A measurement of the size and position of the tumour observed by palpation with the fingers. A serious case is coded as 1 and a less serious case as 0 .
grade Another indicator of the seriousness of the cancer which is determined by a pathology reading of a biopsy taken by needle before surgery. A value of 1 indicates a more serious case of cancer.
xray Another measure of the seriousness of the cancer taken from an X-ray reading. A value of 1 indicates a more serious case of cancer.
acid The level of acid phosphatase in the blood serum where high and low.
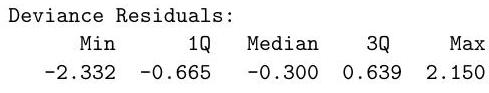
A binomial generalised linear model with a logit link was fitted to the data to predict nodal involvement and the following output obtained:
Part II, 2012 List of Questions
[TURN OVER (a) Give an interpretation of the coefficient of xray.
(b) Give the numerical value of the sum of the squared deviance residuals.
(c) Suppose that the predictors, stage, grade and xray are positively correlated. Describe the effect that this correlation is likely to have on our ability to determine the strength of these predictors in explaining the response.
(d) The probability of observing a value of under a Chi-squared distribution with 52 degrees of freedom is . What does this information tell us about the null model for this data? Justify your answer.
(e) What is the lowest predicted probability of the nodal involvement for any future patient?
(f) The first plot in Figure 1 shows the (Pearson) residuals and the fitted values. Explain why the points lie on two curves.
(g) The second plot in Figure 1 shows the value of where indicates that patient was dropped in computing the fit. The values for each predictor, including the intercept, are shown. Could a single case change our opinion of which predictors are important in predicting the response? 
Figure 1: The plot on the left shows the Pearson residuals and the fitted values. The plot on the right shows the changes in the regression coefficients when a single point is omitted for each predictor.