Paper 2, Section I, K
The purpose of the following study is to investigate differences among certain treatments on the lifespan of male fruit flies, after allowing for the effect of the variable 'thorax length' (thorax) which is known to be positively correlated with lifespan. Data was collected on the following variables:
longevity lifespan in days
thorax (body) length in
treat a five level factor representing the treatment groups. The levels were labelled as follows: "00", "10", "80", "11", "81".
No interactions were found between thorax length and the treatment factor. A linear model with thorax as the covariate, treat as a factor (having the above 5 levels) and longevity as the response was fitted and the following output was obtained. There were 25 males in each of the five groups, which were treated identically in the provision of fresh food.
Coefficients :
Residual standard error: on 119 degrees of freedom
Multiple R-Squared: , Adjusted R-squared:
F-statistics: on 5 and 119 degrees of freedom, p-value: 0
(a) Assuming the same treatment, how much longer would you expect a fly with a thorax length greater than another to live?
(b) What is the predicted difference in longevity between a male fly receiving treatment treat 10 and treat81 assuming they have the same thorax length?
(c) Because the flies were randomly assigned to the five groups, the distribution of thorax lengths in the five groups are essentially equal. What disadvantage would the investigators have incurred by ignoring the thorax length in their analysis (i.e., had they done a one-way ANOVA instead)?
(d) The residual-fitted plot is shown in the left panel of Figure 1 overleaf. Is it possible to determine if the regular residuals or the studentized residuals have been used to construct this plot? Explain.
(e) The Box-Cox procedure was used to determine a good transformation for this data. The plot of the log-likelihood for is shown in the right panel of Figure 1 . What transformation should be used to improve the fit and yet retain some interpretability?
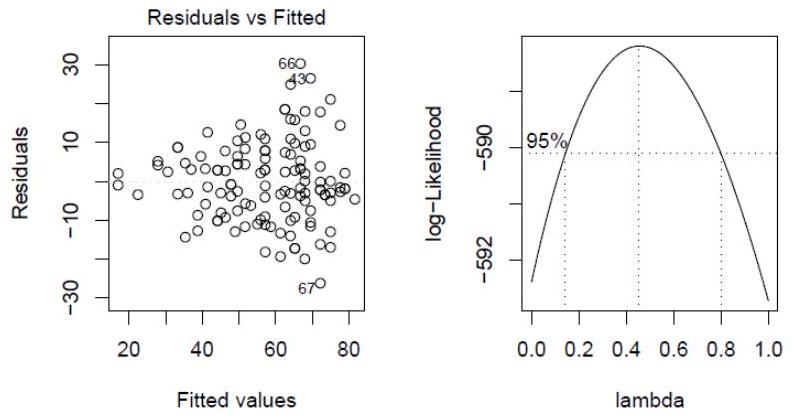
Figure 1: Residual-Fitted plot on the left and Box-Cox plot on the right