2.II.12H
An examination was given to 500 high-school students in each of two large cities, and their grades were recorded as low, medium, or high. The results are given in the table below.
\begin{tabular}{l|ccc} & Low & Medium & High \ \hline City A & 103 & 145 & 252 \ City B & 140 & 136 & 224 \end{tabular}
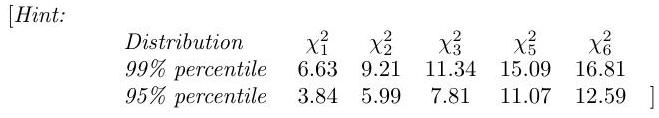
Derive carefully the test of homogeneity and test the hypothesis that the distributions of scores among students in the two cities are the same.
Typos? Please submit corrections to this page on GitHub.